


Industrial Networking: From Modbus to OPC UA in the Age of IIoT
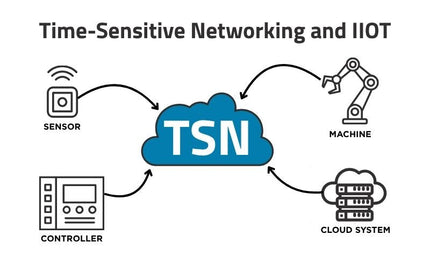
Industrial networking has transformed from serial protocols like Modbus and PROFIBUS to Ethernet-based and IIoT-ready systems such as OPC UA and MQTT. As industries move toward connected, data-driven operations, interoperability, security, and scalability have become essential. Understanding how these protocols evolved reveals how modern networks enable seamless communication between devices, systems, and the cloud.